Lesson 7 Overview

This week we will take a quick tour on how to use Python in QGIS using the processing framework.
Until 2016, this course taught the use of the arcpy module within ArcGIS. Since ArcGIS is a Desktop GIS widely used throughout the private and public sector, feel free to revisit the 2016 course’s Lesson 6.
Learning objectives
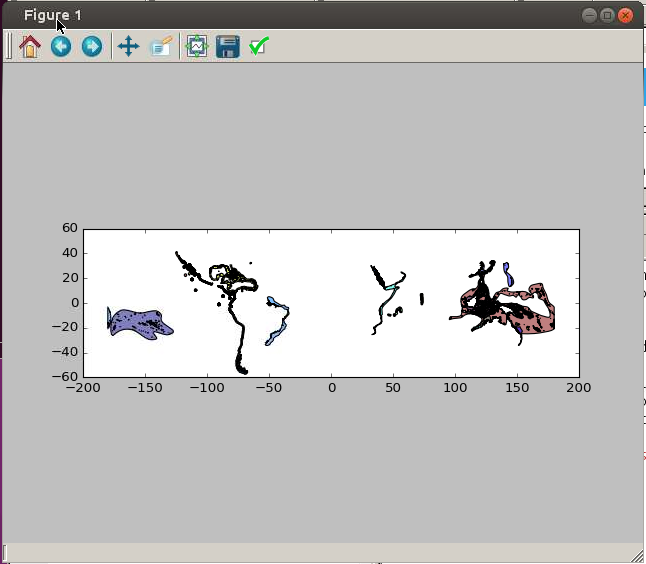
We don’t have any exercise for this week. The aim of this week is to learn the basics of how QGIS tools and algorithms can be run using processing functions, and how custom scripts can be retrofitted with a graphical user interface. In this week’s lesson we will create a QGIS Python tool step by step that converts the individual *Damselfish species distribution polygons* into raster layers (.tif).
After this week’s lesson you should be able to:
Create a simple user interface for a script in the QGIS Processing Toolbox.
Run different QGIS algorithms from Python.
Find and know how to read the PyQGIS and QGIS Processing documentation online.
The data we use this week is the same that we used already during the second week:
Lecture videos
Lesson 7.1 - Introduction to Python in QGIS; Processing toolbox; Graphical modeller
Lesson 7.2 - Python scripting in QGIS 3.4; Creating a processing toolbox with custom Python scripts;