Retrieving data from OpenStreetMap
Contents
Retrieving data from OpenStreetMap#
What is OpenStreetMap?#
OpenStreetMap is a free and open map service, but - first and foremost - it is a collaborative global effort to collect free and open geodata. Source: wiki.openstreetmap.org#
OpenStreetMap (OSM) is a global collaborative (crowd-sourced) database and project that aims at creating a free editable map of the world containing of information about our environment. It contains data about streets, buildings, different services, and landuse, to mention but a few. The collected data is also basis for the map at openstreetmap.org.
Contribute!
You can also sign up as a contributor if you want to add to the database and map or correct and improve existing data. Read more in the OpenStreetMap Wiki.
OSM has more than 8 million registered users who contribute around 4 million changes daily. Its database contains data that is described by more than 7 billion nodes (that make up lines, polygons and other objects).
While the most well-known side of OpenStreetMap is the map itself, that we have used as a background map, the project is much more than that. OSM’s data can be used for many other purposes such as routing, geocoding, education, and research. OSM is also widely used for humanitarian response, e.g., in crisis areas (e.g. after natural disasters) and for fostering economic development. Read more about humanitarian projects that use OSM data from the Humanitarian OpenStreetMap Team (HOTOSM) website.
Main tools in this lesson#
OSMnx#
This week we will explore a Python package called OSMnx that can be used to retrieve street networks from OpenStreetMap, and construct, analyse, and visualise them. OSMnx can also fetch data about Points of Interest, such as restaurants, schools, and different kinds of services. The package also includes tools to find routes on a network downloaded from OpenStreetMap, and implements algorithms for finding shortest connections for walking, cycling, or driving.
To get an overview of the capabilities of the package, watch the introductory video given by the lead developer of the package, Prof. Geoff Boeing: “Meet the developer: Introduction to OSMnx package by Geoff Boeing”.
There is also a scientific article available describing the package:
Boeing, G. 2017. “OSMnx: New Methods for Acquiring, Constructing, Analyzing, and Visualizing Complex Street Networks.” Computers, Environment and Urban Systems 65, 126-139. doi:10.1016/j.compenvurbsys.2017.05.004
This tutorial provides a practical overview of OSMnx functionalities, and has also inspired this AutoGIS lesson.
NetworkX#
We will also use NetworkX to manipulate and analyse the street network data retrieved from OpenStreetMap. NetworkX is a Python package that can be used to create, manipulate, and study the structure, dynamics, and functions of complex networks.
Download and visualise OpenStreetMap data with OSMnx#
A useful feature of OSMnx is its easy-to-use tools to download OpenStreetMap data via the project’s OverPass API. In this section, we will learn how to download and visualise the street network and additional data from OpenStreetMap covering an area of interest.
Street network#
The osmnx.graph
module
downloads data to construct a routable road network graph, based on an
user-defined area of interest. This area of interest can be specified, for
instance, using a place name, a bounding box, or a polygon. Here, we will use
a placename for fetching data covering the Kamppi area in Helsinki, Finland.
In the place name query, OSMnx uses the Nominatim Geocoding API. This means that place names should exist in the OpenStreetMap database (run a test search at openstreetmap.org or nominatim.openstreetmap.org).
We will read an OSM street network using OSMnx’s graph_from_place() function:
import osmnx

PLACE_NAME = "Kamppi, Helsinki, Finland"
graph = osmnx.graph_from_place(PLACE_NAME)
Check the data type of the graph:
type(graph)
networkx.classes.multidigraph.MultiDiGraph
What we have here is a
networkx.MultiDiGraph object.
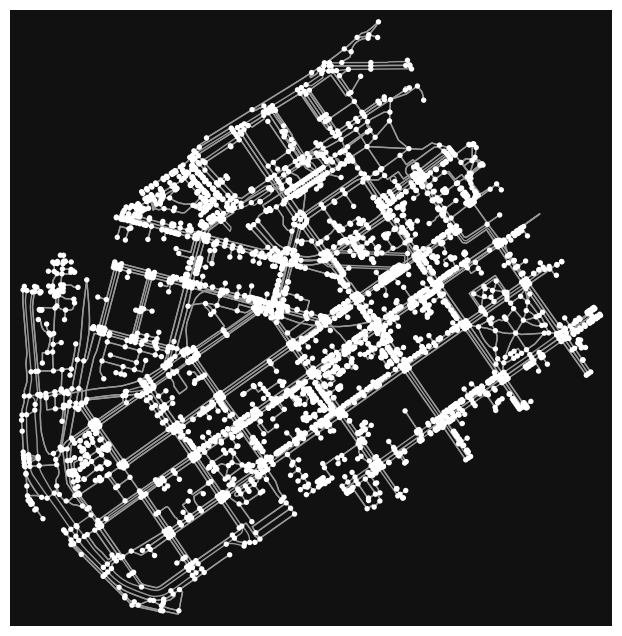
OSMnx’s graphs do not have a built-in method to plot them, but the package comes with a function to do so:
figure, ax = osmnx.plot_graph(graph)

Just as its GeoPandas and Pandas equivalents, osmnx.plot_graph() uses
matplotlib. The function returns a (figure, axes) tuple, that can be used to
modify the figure using all matplotlib functions we already got to know.
We can see that our graph contains nodes (the points) and edges (the lines) that connects those nodes to each other.
Convert a graph to GeoDataFrames#
The street network we just downloaded is a graph, more specifically a
networkx.MultiDiGraph. Its main purpose is to represent the topological
relationships between nodes and the links (edges) between them. Sometimes, it
is more convenient to have the underlying geodata in geopandas.GeoDataFrames.
OSMnx comes with a convenient function that converts a graph into two geo-data
frames, one for nodes, and one for edges:
osmnx.graph_to_gdfs().
nodes, edges = osmnx.graph_to_gdfs(graph)
nodes.head()
| y | x | street_count | highway | ref | geometry | |
|---|---|---|---|---|---|---|
| osmid | ||||||
| 25216594 | 60.164794 | 24.921057 | 5 | NaN | NaN | POINT (24.92106 60.16479) |
| 25238874 | 60.163665 | 24.921028 | 4 | NaN | NaN | POINT (24.92103 60.16366) |
| 25238883 | 60.163452 | 24.921441 | 4 | crossing | NaN | POINT (24.92144 60.16345) |
| 25238933 | 60.161114 | 24.924529 | 3 | NaN | NaN | POINT (24.92453 60.16111) |
| 25238937 | 60.160860 | 24.925861 | 3 | NaN | NaN | POINT (24.92586 60.16086) |
edges.head()
| osmid | oneway | lanes | name | highway | maxspeed | reversed | length | geometry | junction | width | tunnel | access | bridge | service | |||
|---|---|---|---|---|---|---|---|---|---|---|---|---|---|---|---|---|---|
| u | v | key | |||||||||||||||
| 25216594 | 1372425721 | 0 | 23717777 | True | 2 | Porkkalankatu | primary | 40 | False | 10.404 | LINESTRING (24.92106 60.16479, 24.92087 60.16479) | NaN | NaN | NaN | NaN | NaN | NaN |
| 1372425714 | 0 | 23856784 | True | 2 | Mechelininkatu | primary | 40 | False | 40.885 | LINESTRING (24.92106 60.16479, 24.92095 60.164... | NaN | NaN | NaN | NaN | NaN | NaN | |
| 25238874 | 336192701 | 0 | 29977177 | True | 3 | Mechelininkatu | primary | 40 | False | 5.843 | LINESTRING (24.92103 60.16366, 24.92104 60.16361) | NaN | NaN | NaN | NaN | NaN | NaN |
| 1519889266 | 0 | 930820886 | True | 1 | Itämerenkatu | tertiary | 30 | False | 10.879 | LINESTRING (24.92103 60.16366, 24.92083 60.16366) | NaN | NaN | NaN | NaN | NaN | NaN | |
| 25238883 | 568147264 | 0 | 58077048 | True | 4 | Mechelininkatu | primary | 40 | False | 15.388 | LINESTRING (24.92144 60.16345, 24.92140 60.16359) | NaN | NaN | NaN | NaN | NaN | NaN |
Nice! Now, as we can see, we have our graph as GeoDataFrames and we can plot them using the same functions and tools as we have used before.
Place polygon#
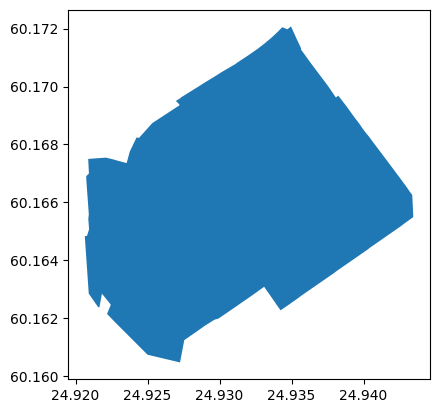
Let’s also plot the polygon that represents our area of interest (Kamppi, Helsinki). We can retrieve the polygon geometry using the [osmnx.geocode_to_gdf()](https://osmnx.readthedocs.io/en/stable/osmnx.html?highlight=geocode_to_gdf(#osmnx.geocoder.geocode_to_gdf) function.
# Get place boundary related to the place name as a geodataframe
area = osmnx.geocode_to_gdf(PLACE_NAME)
As the name of the function already tells us, it returns a GeoDataFrame object based on the specified place name query. Let’s still verify the data type:
# Check the data type
type(area)
geopandas.geodataframe.GeoDataFrame
Let’s also have a look at the data:
# Check data values
area
| geometry | bbox_north | bbox_south | bbox_east | bbox_west | place_id | osm_type | osm_id | lat | lon | class | type | place_rank | importance | addresstype | name | display_name | |
|---|---|---|---|---|---|---|---|---|---|---|---|---|---|---|---|---|---|
| 0 | POLYGON ((24.92064 60.16483, 24.92069 60.16447... | 60.172075 | 60.160469 | 24.943453 | 24.920643 | 180300156 | relation | 184714 | 60.168535 | 24.930494 | boundary | administrative | 20 | 0.430313 | suburb | Kamppi | Kamppi, Southern major district, Helsinki, Hel... |
# Plot the area:
area.plot()
<AxesSubplot: >

Building footprints#
Besides network data, OSMnx can also download any other data contained in the OpenStreetMap database. This includes, for instance, building footprints, and different points-of-interests (POIs). To download arbitrary geometries, filtered by OSM tags and a place name, use osmnx.geometries_from_place() [geometries is soon deprecated - Let’s already use features instead]. The tag to retrieve all buildings is building = yes.
buildings = osmnx.geometries_from_place(
    PLACE_NAME,
    {"building": True},
)
len(buildings)
452
buildings.head()
| ele | geometry | amenity | operator | wheelchair | source | access | addr:housenumber | addr:street | addr:unit | ... | drive_through | ice_cream | lippakioski | covered | area | leisure | ways | type | electrified | nohousenumber | ||
|---|---|---|---|---|---|---|---|---|---|---|---|---|---|---|---|---|---|---|---|---|---|---|
| element_type | osmid | |||||||||||||||||||||
| way | 8035238 | NaN | POLYGON ((24.93563 60.17045, 24.93557 60.17054... | NaN | NaN | NaN | NaN | NaN | 22-24 | Mannerheimintie | NaN | ... | NaN | NaN | NaN | NaN | NaN | NaN | NaN | NaN | NaN | NaN |
| 8042297 | NaN | POLYGON ((24.92938 60.16795, 24.92933 60.16797... | NaN | NaN | NaN | NaN | NaN | 2 | Runeberginkatu | NaN | ... | NaN | NaN | NaN | NaN | NaN | NaN | NaN | NaN | NaN | NaN | |
| 14797170 | NaN | POLYGON ((24.92427 60.16648, 24.92427 60.16650... | NaN | City of Helsinki | NaN | survey | NaN | 10 | Lapinlahdenkatu | NaN | ... | NaN | NaN | NaN | NaN | NaN | NaN | NaN | NaN | NaN | NaN | |
| 14797171 | NaN | POLYGON ((24.92390 60.16729, 24.92391 60.16731... | NaN | NaN | NaN | survey | NaN | NaN | NaN | NaN | ... | NaN | NaN | NaN | NaN | NaN | NaN | NaN | NaN | NaN | NaN | |
| 14797172 | NaN | POLYGON ((24.92647 60.16689, 24.92648 60.16689... | NaN | NaN | NaN | survey | NaN | 2 | Lapinrinne | NaN | ... | NaN | NaN | NaN | NaN | NaN | NaN | NaN | NaN | NaN | NaN |
5 rows × 115 columns
As you can see, there are several columns in buildings. Each column contains
information about a specific tag that OpenStreetMap contributors have added.
Each tag consists of a key (the column name), and a values (for example
building=yes or building=school). Read more about tags and tagging
practices in the OpenStreetMap
wiki.
buildings.columns
Index(['ele', 'geometry', 'amenity', 'operator', 'wheelchair', 'source',
       'access', 'addr:housenumber', 'addr:street', 'addr:unit',
       ...
       'drive_through', 'ice_cream', 'lippakioski', 'covered', 'area',
       'leisure', 'ways', 'type', 'electrified', 'nohousenumber'],
      dtype='object', length=115)
Points-of-interest#
Point-of-interest (POI) is a generic concept that describes point locations
that represent places of interest. As osmnx.geometries_from_place() can download any geometry data contained in the OpenStreetMap database, it can also be used to download any kind of POI data. [geometries is soon deprecated - Let’s already use features instead]
In OpenStreetMap, many POIs are described using the amenity
tag. We can, for example,
retrieve all restaurant locations by querying amenity=restaurant.
restaurants = osmnx.geometries_from_place(
    PLACE_NAME,
    {
        "amenity": "restaurant"
    }
)
len(restaurants)
174
As we can see, there are quite many restaurants in the area.
Let’s explore what kind of attributes we have in our restaurants GeoDataFrame:
# Available columns
restaurants.columns.values
array(['addr:city', 'addr:country', 'addr:housenumber', 'addr:postcode',
       'addr:street', 'amenity', 'cuisine', 'diet:halal', 'diet:kosher',
       'name', 'payment:credit_cards', 'payment:debit_cards', 'phone',
       'website', 'wheelchair', 'geometry', 'email', 'facebook',
       'indoor_seating', 'level', 'opening_hours', 'outdoor_seating',
       'short_name', 'start_date', 'toilets:wheelchair',
       'delivery:covid19', 'opening_hours:covid19', 'takeaway:covid19',
       'diet:vegetarian', 'fixme', 'name:fi', 'name:zh', 'payment:cash',
       'diet:vegan', 'disused:amenity', 'addr:housename',
       'access:covid19', 'drive_through:covid19', 'takeaway',
       'lunch:menu', 'note', 'reservation', 'room', 'contact:facebook',
       'contact:phone', 'opening_hours:brunch', 'source', 'toilets',
       'contact:website', 'capacity', 'smoking', 'dog', 'operator',
       'shop', 'check_date', 'alt_name', 'contact:email', 'established',
       'description', 'diet:non-vegetarian', 'name:sv', 'drive_through',
       'internet_access', 'url', 'floor', 'brand', 'lunch', 'addr:state',
       'description:en', 'old_name', 'addr:unit', 'delivery', 'name:en',
       'highchair', 'contact:instagram', 'lunch:opening_hours',
       'was:name', 'website:en', 'branch', 'check_date:opening_hours',
       'check_date:diet:vegetarian', 'stars', 'wikidata', 'wikipedia',
       'description:covid19', 'lunch:buffet', 'operator:wikidata',
       'operator:wikipedia', 'addr:place', 'addr:floor', 'image',
       'payment:mastercard', 'payment:visa', 'contact:tiktok',
       'brand:wikidata', 'nodes', 'building'], dtype=object)
As you can see, there is quite a lot of (potential) information related to the amenities. Let’s subset the columns and inspect the data further. Can we extract all restaurants’ names, address, and opening hours?
# Select some useful cols and print
interesting_columns = [
    "name",
    "opening_hours",
    "addr:city",
    "addr:country",
    "addr:housenumber",
    "addr:postcode",
    "addr:street"
]

# Print only selected cols
restaurants[interesting_columns].head(10)
| name | opening_hours | addr:city | addr:country | addr:housenumber | addr:postcode | addr:street | ||
|---|---|---|---|---|---|---|---|---|
| element_type | osmid | |||||||
| node | 60062502 | Kabuki | NaN | Helsinki | FI | 12 | 00180 | Lapinlahdenkatu |
| 62965963 | Restaurant & Bar Fusion | Mo-Th 11-22; Fr-Sa 11-02; Su 12-20 | NaN | NaN | NaN | NaN | NaN | |
| 76617692 | Johan Ludvig | NaN | Helsinki | FI | NaN | NaN | NaN | |
| 76624339 | Shinobi | We-Th 17:00-23:00; Fr-Sa 16:00-24:00 | Helsinki | FI | 38 | 00120 | Albertinkatu | |
| 76624351 | Pueblo | NaN | Helsinki | FI | NaN | NaN | Eerikinkatu | |
| 151006260 | Ravintola China | Mo-Fr 11:00-23:00; Sa-Su 12:00-23:00; PH off | Helsinki | FI | 25 | 00100 | Annankatu | |
| 151006483 | Tony's deli + Street Bar | NaN | Helsinki | FI | 7 | 00120 | Bulevardi | |
| 151006932 | Haru Sushi | Mo-Fr 11:00-21:00; Sa 12:00-21:00; Su 13:00-21:00 | Helsinki | FI | 30 | 00120 | Fredrikinkatu | |
| 151006967 | Game Taste Cafe | NaN | Helsinki | FI | 21 | NaN | Lönnrotinkatu | |
| 151007074 | Koto | NaN | Helsinki | FI | 22 | 00120 | Lönnrotinkatu |
Tip
if some of the information needs an update, head over to openstreetmap.org and edit the source data!
Parks and green areas#
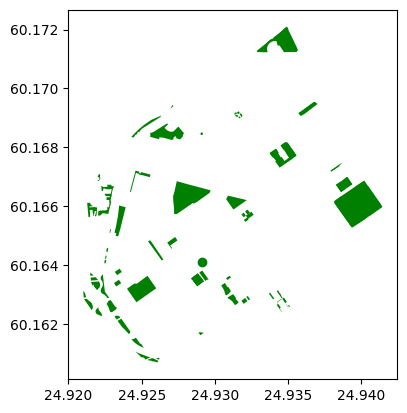
Let’s try to fetch all public parks in the Kamppi area. In OpenStreetMap,
parks hould be tagged as
leisure = park. Smaller green areas (puistikot) are sometimes also tagged
landuse = grass. We can combine multiple tags in one data query.
parks = osmnx.geometries_from_place(
    PLACE_NAME,
    {
        "leisure": "park",
        "landuse": "grass",
    },
)
parks.head()
| geometry | access | source | addr:city | leisure | loc_name | nodes | name | name:fi | name:sv | hoitoluokitus_viheralue | wikidata | wikimedia_commons | wikipedia | landuse | alt_name | ||
|---|---|---|---|---|---|---|---|---|---|---|---|---|---|---|---|---|---|
| element_type | osmid | ||||||||||||||||
| node | 9577568989 | POINT (24.92915 60.16411) | NaN | NaN | NaN | park | Kirveen puisto | NaN | NaN | NaN | NaN | NaN | NaN | NaN | NaN | NaN | NaN |
| way | 8042256 | POLYGON ((24.93566 60.17132, 24.93566 60.17130... | NaN | NaN | NaN | park | NaN | [292719496, 1001543836, 1037987967, 1001544060... | Pikkuparlamentin puisto | Pikkuparlamentin puisto | Lilla parlamentets park | NaN | NaN | NaN | NaN | NaN | NaN |
| 8042613 | POLYGON ((24.93701 60.16947, 24.93627 60.16919... | NaN | NaN | NaN | park | NaN | [552965718, 293390264, 295056669, 256264975, 1... | Simonpuistikko | Simonpuistikko | Simonsskvären | NaN | NaN | NaN | NaN | NaN | NaN | |
| 15218362 | POLYGON ((24.92330 60.16499, 24.92323 60.16500... | NaN | survey | NaN | park | NaN | [144181223, 150532964, 150532958, 150532966, 1... | Työmiehenpuistikko | Työmiehenpuistikko | Arbetarparken | A2 | NaN | NaN | NaN | NaN | NaN | |
| 15218739 | POLYGON ((24.92741 60.16575, 24.92741 60.16574... | NaN | NaN | NaN | park | NaN | [1876856069, 1876856056, 1876856052, 187685606... | Lastenlehto | Lastenlehto | Barnslunden | A2 | Q18660505 | Category:Lastenlehto Park | fi:Lastenlehto | NaN | NaN |
parks.plot(color="green")
<AxesSubplot: >

Plotting the data#
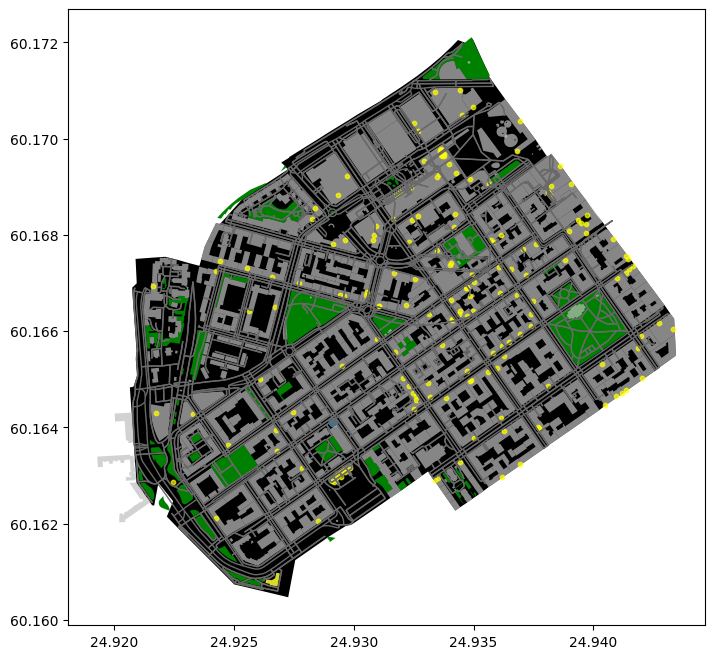
Let’s create a map out of the streets, buildings, restaurants, and the area polygon.
import matplotlib
figure, ax = matplotlib.pyplot.subplots(figsize=(12,8))

# Plot the footprint
area.plot(ax=ax, facecolor="black")

# Plot parks
parks.plot(ax=ax, facecolor="green")

# Plot street ‘edges’
edges.plot(ax=ax, linewidth=1, edgecolor="dimgray")

# Plot buildings
buildings.plot(ax=ax, facecolor="silver", alpha=0.7)

# Plot restaurants
restaurants.plot(ax=ax, color="yellow", alpha=0.7, markersize=10)
<AxesSubplot: >

Cool! Now we have a map where we have plotted the restaurants, buildings, streets and the boundaries of the selected region of ‘Kamppi’ in Helsinki. And all of this required only a few lines of code. Pretty neat!
Check your understanding
Retrieve OpenStreetMap data from some other area! Download these elements using OSMnx functions from your area of interest:
Extent of the area using
geocode_to_gdf()Street network using
graph_from_place(), and convert to geo-data frame usinggraph_to_gdfs()Building footprints (and other geometries) using
geometries_from_place()and appropriate tags.
Note, the larger the area you choose, the longer it takes to retrieve data from the API!
# Specify the name that is used to seach for the data. Check that the place
# name is valid from https://nominatim.openstreetmap.org/ui/search.html
MY_PLACE = ""
# Get street network
# Get building footprints
# Plot the data
Advanced reading#
To analyse OpenStreetMap data over large areas, it is often more efficient and meaningful to download the data all at once, instead of separate queries to the API. Such data dumps from OpenStreetMap are available in various file formats, OSM Protocolbuffer Binary Format (PBF) being one of them. Data extracts covering whole countries and continents are available, for instance, at download.geofabrik.de.
Pyrosm is a Python package for reading
OpenStreetMap data from PBF files into geopandas.GeoDataFrames. Pyrosm makes
it easy to extract road networks, buildings, Points of Interest (POI), landuse,
natural elements, administrative boundaries and much more - similar to OSMnx,
but taylored to analyses of large areas. While OSMnx reads the data from the
Overpass API, pyrosm reads the data from a local PBF file.
Read more about fetching and using pbf files as a source for analysing OpenStreetMap data in Python from the pyrosm documentation.
